


The sport becomes more and more a social activity. Nowadays there are many applications to control all the physical activity that every individual does when performing sports.
A blog targeted for data visualization decided to analyze the path while people do sport in different cities of the world
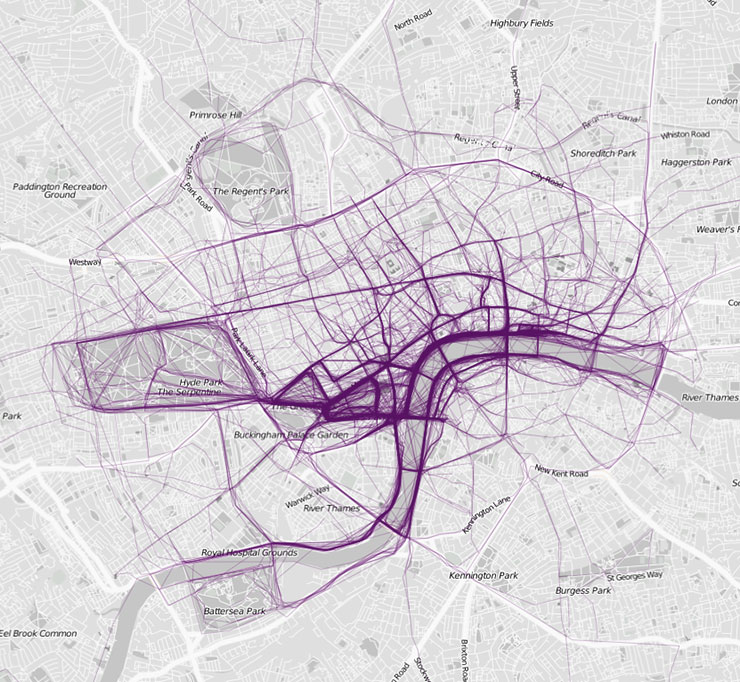
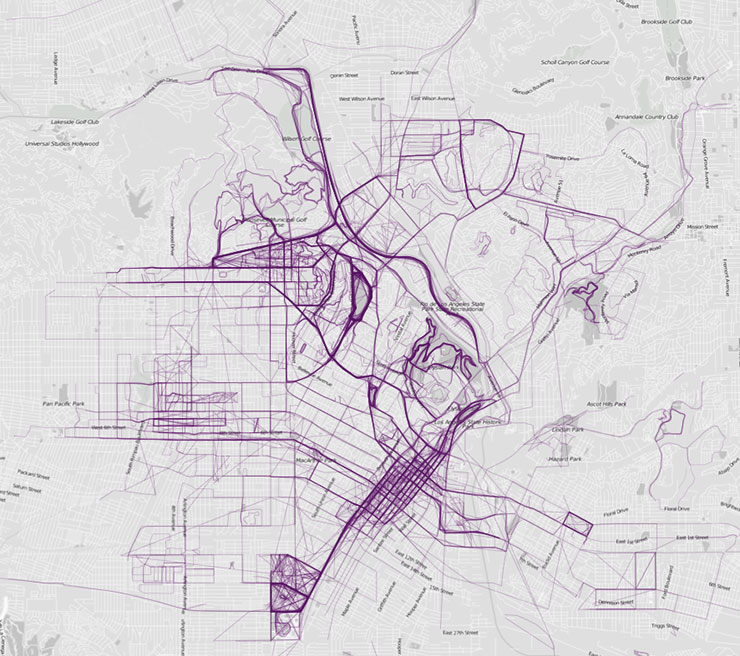
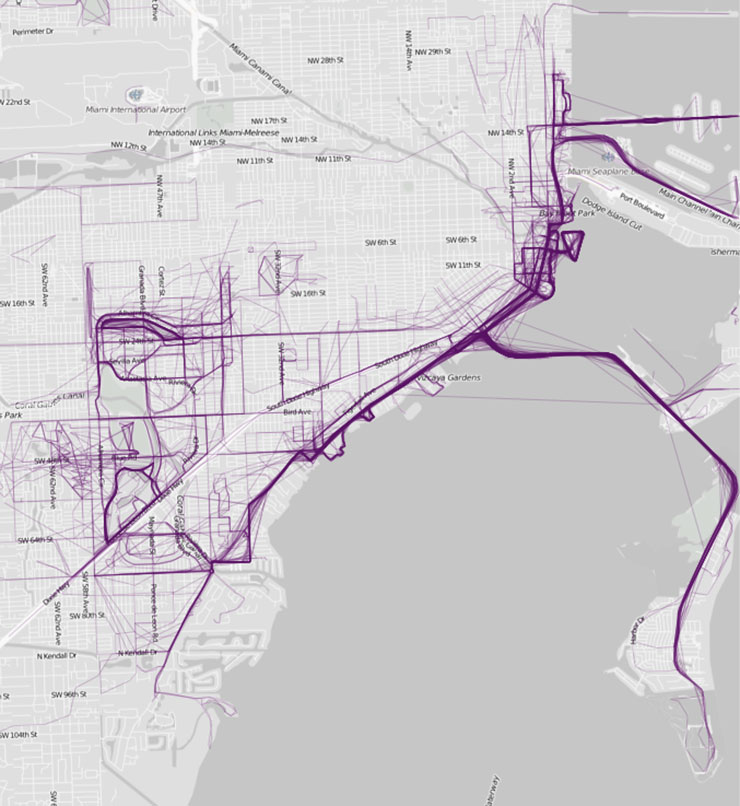
The displacement of individuals creates a graphic on the maps, creating patches of abstract color.
These maps help infere several conclusions, habits, routines …
In this study we can see the result of a symbiosis between two completely different things: sports and graphic design.
BOSTON

LONDON
LOS ANGELES
MIAMI


Comments